Reliance RS50 eVTOL Battery Pack Design

1 Reliance RS50 for eVTOL
1.1 Reliance RS50 cell positioning
The Reliance RS50 (also known as the Reliance INR21700-RS50) is a 5 Ah tabless cylindrical 21700 lithium-ion cell rated for 70 A continuous discharge, with 269 Wh/kg energy density. An eVTOL battery pack needs both: very high power for take-off and landing, and a lower sustained power through cruise. This paper uses 70 A as the maximum current throughout, with the datasheet's 80 °C temperature cut-off and 2.5 V lower voltage limit.
Our initial capacity check on the Reliance RS50, a C/30 discharge run before the 8-week test programme that builds the Voltt data and models, measured 5.27 Ah. This is 6% above the 4.95 Ah datasheet minimum, which covers cell-to-cell variation, so size the pack against the minimum.
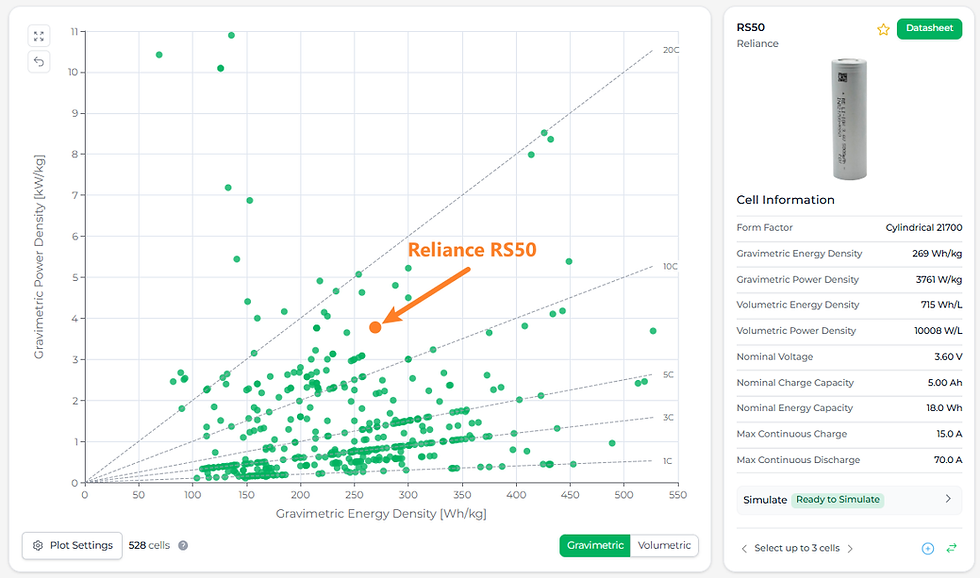
Figure 1.1 places the Reliance RS50 against the 530 cells in the Voltt library. It sits toward the upper right of the field, the region that matters for eVTOL and aviation: high power density without a loss of the energy density that sets endurance. Cells to the left offer comparable power density with lower energy density, and so less range, while cells below offer similar energy density but cannot supply the current an eVTOL take-off demands.
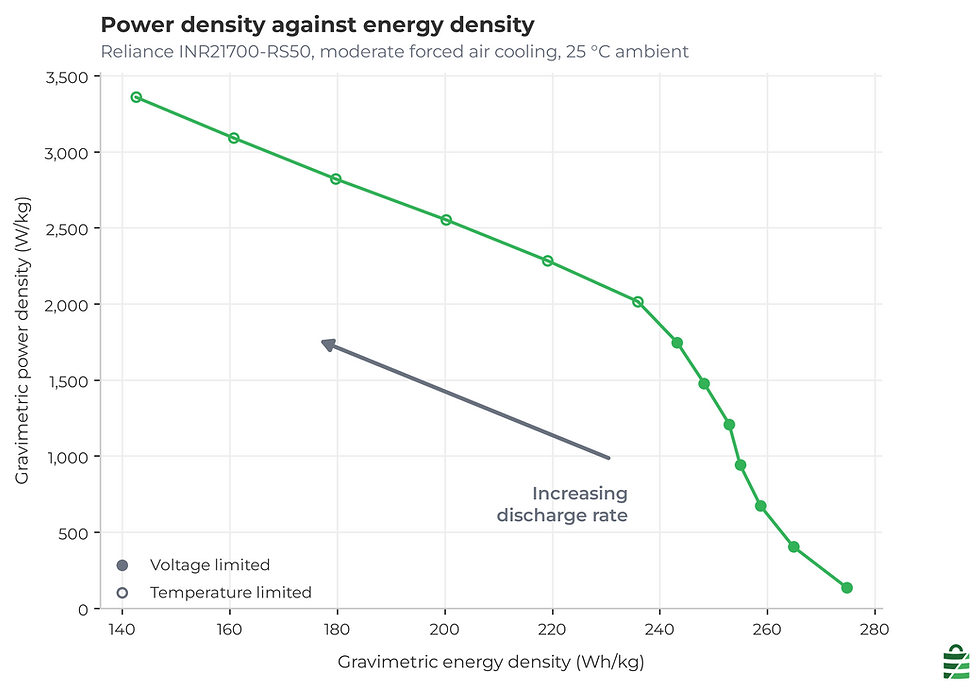
Figure 1.2 shows how the Reliance RS50 power density and energy density change as the discharge rate increases. The two trade against each other along a single curve, and the marker style shows which limit ended each discharge. At lower rates the discharge ends at the 2.5 V lower voltage limit. At higher rates the cell reaches 80 °C first, and the discharge ends with usable capacity remaining. The discharge rate at which the cell becomes thermally limited rather than voltage limited depends on the cooling as much as on the cell, and sections 2.2 and 2.3 quantify it.
1.2 Reliance RS50 pack design questions
Cell selection sets the ceiling on pack performance and the floor on pack cost, which makes it a strategic decision for any eVTOL battery pack programme. Energy density sets pack mass, and the peak current demand sets the number of cells in parallel. The thermal architecture follows from the heat the cell generates at the mission's discharge rates and from the cell surface area the mechanical design can expose to the cooling. In an eVTOL, where mass drives range and thermal runaway is not survivable, a cell chosen on datasheet headline figures cannot be changed late in the programme without redesigning the pack.
A datasheet reports capacity at a few discharge rates, under cooling conditions that are rarely stated and rarely representative of a packed module. It does not report dynamic behaviour: peak temperature under sustained load, voltage sag across the discharge, or pulse power at low state of charge. Those gaps decide whether a pack meets its requirements. Closing them by test means cyclers, thermal chambers, instrumentation and weeks of qualification for every candidate cell.
Voltt is About:Energy's battery cell selection platform. It provides validated models for more than 50 high-performance cells, each parameterised against measurements from About:Energy's laboratory so that it responds as the measured cell does rather than as the datasheet implies, and free data on more than 500. In this paper we use Voltt to answer five eVTOL pack design questions for the Reliance RS50 before any hardware is built: the current the pack hardware must be rated for (section 2.1), the usable capacity at each cooling level (section 2.2), the cooling each discharge rate needs and on which cell surface (section 2.3), the BMS pulse limits and minimum state of charge (section 2.4), and whether a 222s16p pack completes a full eVTOL flight (section 3).
2 Reliance RS50 cell performance
2.1 Reliance RS50 pack current sizing
The Reliance RS50 is characterised under constant current and constant power discharge, the two control modes a pack sees. Datasheets report, and cells are compared, at constant current. A propulsion system loads the pack at constant power, since the motor controller draws the current needed to sustain thrust. At constant current, power falls as terminal voltage falls; at constant power, current rises to sustain the power.
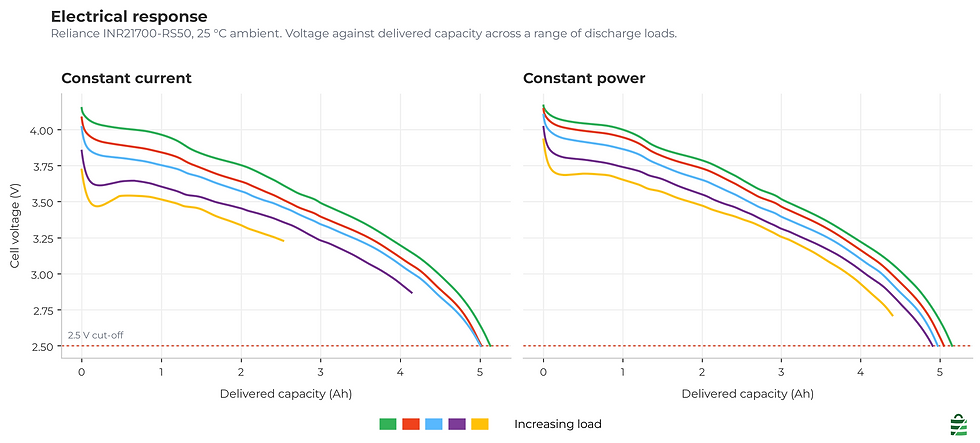
The discharge curves overlap at the start of discharge and separate as the discharge rate increases. The separation is polarisation: under load, terminal voltage sits below open-circuit voltage by approximately the product of current and internal resistance, and the offset grows with current. At the highest rates the discharge does not reach 2.5 V. Resistive heat generation scales with the square of current, so the Reliance RS50 reaches 80 °C with usable capacity remaining, and the discharge ends on the temperature limit. The cell is thermally limited: the energy remains in the cell, but the pack cannot reject heat fast enough to extract it. That distinction sets where the engineering effort goes, because adding cells in parallel lowers the current per cell but does not change the heat each cell must reject at a given C-rate.
The control mode also sets the pack hardware current rating. Under constant power, current rises as terminal voltage falls, so the peak current occurs at the end of discharge, where the cell is least able to supply it. Conductors, contactors and current sensors must be rated for this end-of-discharge current, not for the nominal value. On a cell with a lower current rating the same profile would exceed it. The options are then a minimum state of charge limit that ends the discharge before the current rises, or more cells in parallel to reduce per-cell current.
2.2 Reliance RS50 usable capacity and cooling
Recording which limit ended each run shows whether a shortfall in usable pack energy comes from the cell or from the thermal design.
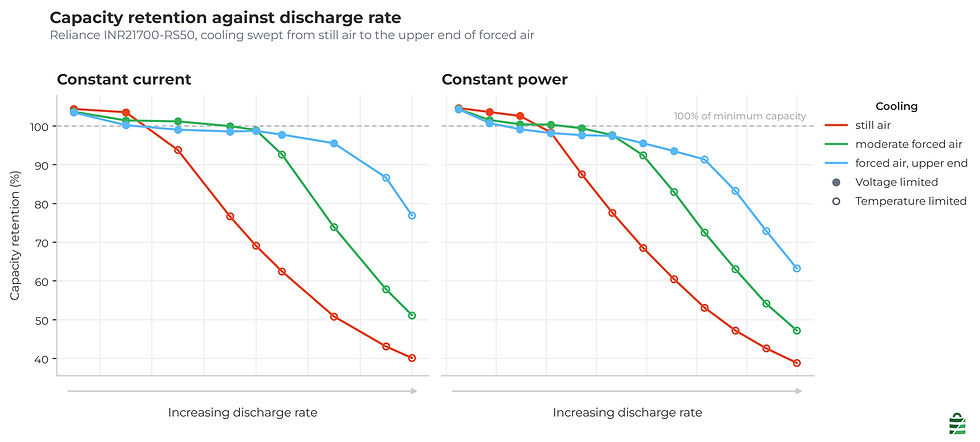
Figure 2.2 shows Reliance RS50 retention against discharge rate for three cooling levels in both control modes. Filled markers ended at the 2.5 V lower voltage limit, hollow markers at the 80 °C limit. Retention slightly above 100% at low rates is expected, because the reference is the datasheet minimum beginning-of-life capacity rather than a typical value. It is not margin to design against.
Two effects act across the range. At low rates a better-cooled cell runs cooler and has higher internal resistance, so it polarises more and delivers marginally less capacity. This is why the curves cross at the low end. As the rate increases, heat generation exceeds heat rejection, the cell reaches 80 °C before 2.5 V, and retention drops sharply. The rate at which this happens, the thermal limit onset, moves from 4.2C at 10 W/m²K to 8.4C at 50 W/m²K and 12.2C at 100 W/m²K: a factor of nearly three across the cooling levels simulated.
The thermal limit onset is therefore set by the cell and the thermal design together. Internal resistance sets the heat generated at a given current; the cooling configuration sets the rate at which that heat is rejected. A lower-resistance cell reaches the onset at a higher rate, and better cooling raises it further, widening the range over which the cell stays voltage limited and delivers close to full capacity.
2.3 Reliance RS50 thermal management
The Reliance RS50 datasheet states a temperature cut-off but not the cooling needed to stay below it. That cooling requirement is an input to the battery thermal management design, and simulation is the fastest way to obtain it.
2.3.1 Reliance RS50 continuous C-rate limit

Figure 2.3.1 plots Reliance RS50 peak cell temperature against discharge rate for the three cooling levels, with the 80 °C limit marked. Peak temperature rises with rate, and better cooling lowers it at any given rate. The rate at which each curve meets the limit is the highest that cooling level sustains continuously: 4.2C at 10 W/m²K, 8.4C at 50 W/m²K and 12.2C at 100 W/m²K under constant current.
The constant current panel is the basis for comparing cells against datasheets; the constant power panel is the basis for sizing a propulsion system. Under constant power the limit is reached at a lower nominal rate, because current rises through the discharge (section 2.1), so the end of the run generates more heat than the nominal rate implies. At 50 W/m²K the cell sustains 8.4C under constant current but 132 W under constant power, which is about 37 A, or 7.3C, at nominal voltage. Specifying the load in watts rather than amps costs about 1.1C of continuous capability at the same cooling. Where the load is specified in power, size the cooling from the constant power results.
2.3.2 Reliance RS50 cooling by contact geometry
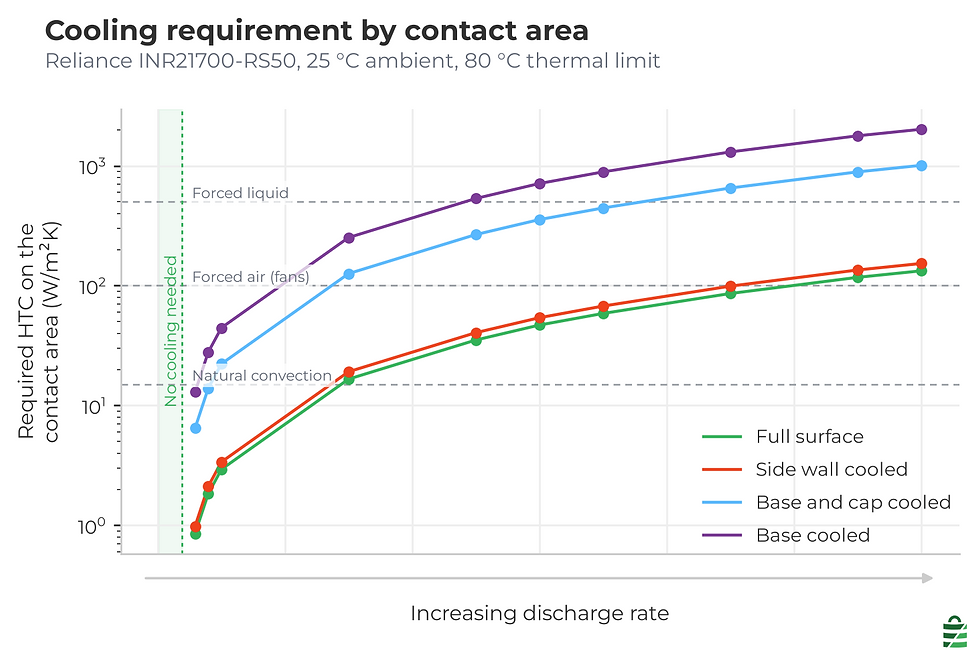
Figure 2.3.2 inverts the previous result: it gives the heat transfer coefficient required at each discharge rate to hold the Reliance RS50 below 80 °C.
Below 2.4C the requirement is zero. A full discharge does not generate enough heat to reach 80 °C even with no heat removal, so the cell tolerates an adiabatic installation. This region is shaded, and it applies to a low-rate reserve or a ground-idle condition. Above it the requirement rises steeply. The design question is the rate at which the requirement exceeds the capability of the chosen cooling technology, which is why the natural convection, forced air and forced liquid levels are marked.
Four contact geometries were simulated, because a real pack does not cool the whole cell surface: the full surface (100% of the cell area), the side wall only (87%), the base and cap (13%), and the base only (7%). Voltt resolves the requirement onto the cooled surface. Side wall cooling stays close to the full-surface case. Base and cap cooling needs 7.6 times the full-surface coefficient on the contact area, and base-only cooling 15.2 times. Voltt models the cell as a single lumped thermal mass, so these multipliers scale with contact area alone.
Contact geometry therefore has a large influence on the cooling requirement, alongside the choice of cooling technology. Neither arrangement is better in general, since each has system-level trade-offs in packaging, mass, manifolding and cell spacing. The cooling technology and contact geometry are chosen together and early. At a given discharge rate a base-cooled design needs 7.6 to 15.2 times the coefficient of a side-cooled one, so it leaves the forced air range at a much lower rate. Liquid cooling raises the achievable coefficient and extends the range over which base cooling is viable, but it does not remove the difference between the two geometries. Where packaging fixes the contact area first, the cooling technology is sized to that multiplier.
2.4 Reliance RS50 pulse power and BMS limits
Continuous ratings do not cover the peak demands of a flight. A rapid climb, a gust response, an aborted landing or an emergency manoeuvre each demands a short pulse well above cruise power, at whatever state of charge and cell temperature the pack is at.

State of charge has the strongest effect on Reliance RS50 pulse power. Across the upper two thirds of the state of charge range the envelope falls by less than a fifth, because pulse power is limited by the 70 A maximum current, applied as the pulse limit by assumption since the datasheet gives no pulse rating, and so declines only with terminal voltage. Below roughly 25% state of charge, pulse power drops sharply: open-circuit voltage falls, internal resistance rises, and the cell can no longer hold terminal voltage above the lower limit at the pulse current. This paper calls that transition the knee, and places it at the state of charge where pulse power has halved. At 25 °C that is 19.4% for a 60 s pulse, 14.2% at 30 s and 10.9% at 10 s.
Temperature affects both the pulse power and the position of the knee. Above the knee the isotherms converge, since the cell is already at its current limit and a higher temperature cannot raise it. Below the knee they separate, because the limit is now terminal voltage under load, and internal resistance rises as temperature falls. A warmer cell therefore delivers more pulse power at low state of charge, and moves the knee to a lower state of charge, extending the range over which full pulse power is available. A pack that enters the landing phase cold, for example after a long cruise in cold ambient air, has reduced pulse capability where a pulse is most likely to be needed, which is the case for thermal conditioning.
Pulse duration follows the same pattern. Above the knee the 10, 30 and 60 s envelopes coincide, since all three are limited by the same maximum current. Below it a shorter pulse delivers more power than a longer one, because the cell has less time to polarise or self-heat towards its thermal limit. For the BMS this gives a simple rule: above the knee a single current limit applies at any duration, and below it the limit must be a function of temperature and duration.
Voltt provides the full Reliance RS50 pulse map as a lookup table indexed by state of charge, temperature and duration, for use in BMS limit tables.
3 Reliance RS50 eVTOL pack mission
Sections 2.1 to 2.4 characterise the Reliance RS50 under constant loads, which define its operating limits. A flight holds no load constant for long. Power varies across take-off, climb, cruise, approach and landing, each transition produces a voltage transient, and heat accumulates across the profile. Verifying that a pack meets its requirements therefore requires simulating the full duty cycle.
The duty cycle is a complete eVTOL flight on a pack sized for a two to four seat air taxi. The cruise duration was solved so that the flight lands at a 25% state of charge target, so the mission length reflects the energy this pack holds, while take-off, climb and landing power come from the profile. 222 cells in series give 799 V nominal and 932 V at the 4.2 V charge limit. At the 371 kW peak each of the 3552 cells supplies 104 W, which is 34 A at the 3.048 V minimum cell voltage, half the 70 A continuous rating.
Reliance RS50 pack configuration
222s16p, 3552 cells
799 V nominal, 80 Ah
63.9 kWh total energy
238 kg of cells, before structure, busbars, cooling and enclosure
Simulation conditions
100% initial state of charge
25 °C initial cell temperature, 25 °C ambient
Forced air cooling with active thermal management, 70 W/m²K applied to the whole cell surface
2.5 V per cell voltage cut-off, 555 V at pack level
80 °C thermal cut-off
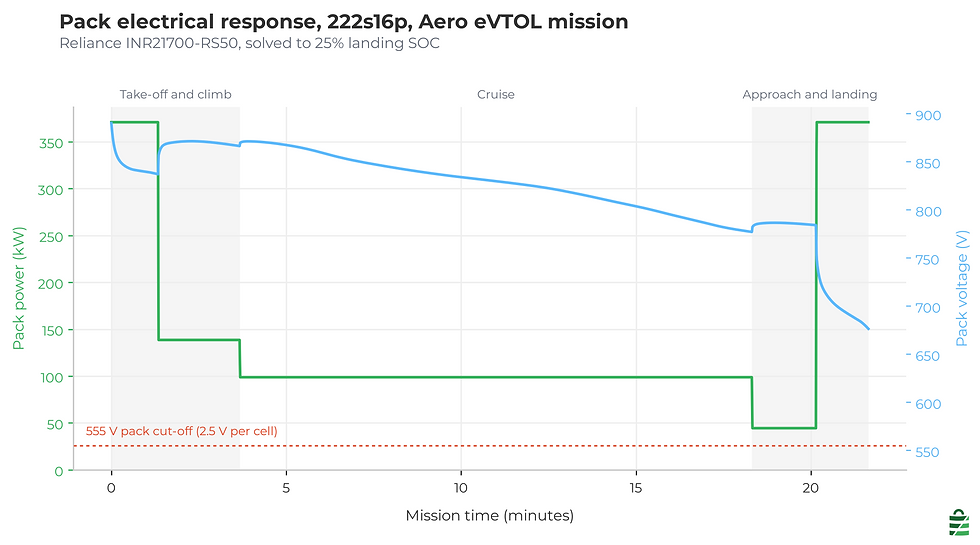
Pack voltage starts at 890 V, drops at take-off as polarisation builds, recovers as climb power reduces, then falls steadily through cruise as state of charge decreases. The minimum of 677 V occurs at the end of landing, where the highest power of the flight coincides with the lowest state of charge. This is 3.048 V per cell, 0.55 V above the 2.5 V limit, so the pack is not voltage limited at any point. The flight draws 48.3 kWh of the 63.9 kWh installed, with a peak demand of 371 kW at take-off and at landing.
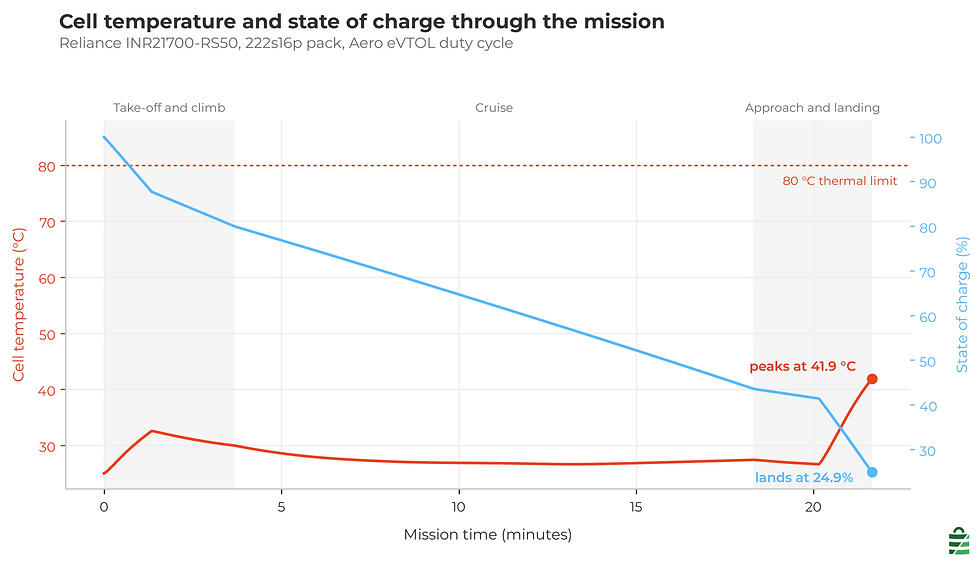
Reliance RS50 cell temperature rises to 30.0 °C through take-off and climb, then falls back to 27.4 °C across cruise, where heat rejection exceeds the heat generated at cruise power. The cell therefore begins the landing 2.5 °C below its climb peak rather than heat soaked. Peak temperature is 41.9 °C, reached during landing, a rise of under 17 °C that leaves 38 °C of margin to the 80 °C limit. A pack that accumulated heat through cruise would start the landing with less margin and reach a higher peak.
Two results follow from the duty cycle. The mean discharge rate over the flight is below the 2.4C rate at which any cooling is required, so take-off and landing largely size the thermal system, and it does not need to run continuously. And because the landing peak coincides with the lowest state of charge of the flight, pulse capability at landing informs the state of charge reserve. Section 2.4 places the knee at 19.4% state of charge for a 60 s pulse, and this mission lands at 24.9%: above the knee but on the declining part of the envelope. At that state of charge a 60 s pulse delivers 62% of its peak value, and is limited by terminal voltage rather than by the current rating. Any additional energy draw, such as a longer cruise or a go-around, moves the landing closer to the knee.
The mission completes within both limits. The flight lasts 21.6 minutes and lands at 24.9% state of charge, above a typical 15% energy reserve.
4 Reliance RS50 conclusions
The Reliance RS50 combines a 70 A continuous current rating with 269 Wh/kg energy density. Across the lower and middle part of its discharge rate range it delivers close to full capacity, with each discharge ending at the 2.5 V lower voltage limit.
Thermal management is significant to how much of that range is usable. Above the thermal limit onset the discharge ends at 80 °C and delivered capacity falls, so the usable capacity of this cell depends on the pack as much as on the cell. The highest sustainable discharge rate varies from 4.2C to 12.2C across the cooling levels simulated, and the contact geometry changes the required heat transfer coefficient by up to a factor of 15.
At pack level the 222s16p configuration completes the 21.6 minute mission and lands at 24.9% state of charge, drawing 48.3 kWh of the 63.9 kWh installed. Minimum cell voltage is 3.048 V and peak cell temperature is 41.9 °C, both well inside their limits.
Two limits bound the operating envelope, and neither appears on a datasheet. First, continuous operation near 70 A needs a heat transfer coefficient above the forced air range on any contact geometry, and 7.6 to 15.2 times more again on a base-cooled contact. The cooling technology and the contact geometry are therefore one decision, made early: the technology sets which contact geometries are viable at the pack's continuous rate. Second, below roughly 25% state of charge, pulse power falls faster than an energy-based reserve calculation assumes, so the minimum operational state of charge must be set on pulse power as well as on remaining energy.
Both are pack design inputs, and neither is on a datasheet. The workflow in this paper produced them from a validated cell model before any cell was bought or any test rig built: cell positioning, the current rating under constant power, usable capacity at each cooling level, the cooling requirement on each contact geometry, the pulse map for BMS limits, and a solved mission on a sized pack. Run in Voltt, the same workflow screens each candidate cell in the concept phase, fixes the contact geometry and cooling technology before the mechanical design, and sets BMS limits before the first pack is built. That greatly accelerates pack development against sourcing and testing each candidate cell, which takes weeks per cell.
To evaluate the Reliance RS50 against your own mission profile, open the Reliance RS50 in the Voltt battery library or explore Voltt at About:Energy.
5 Reliance RS50 FAQs
What is the Reliance RS50?
The Reliance RS50, also sold as the INR21700-RS50, is a 5 Ah cylindrical 21700 lithium-ion cell released in 2024. It is rated for 70 A continuous discharge at 269 Wh/kg, which places it among the high-power cells that keep the energy density needed for eVTOL endurance.
How many Reliance RS50 cells does an eVTOL battery pack need?
The pack simulated here is 222s16p: 3552 Reliance RS50 cells, 799 V nominal and 63.9 kWh, with 238 kg of cells for a two to four seat air taxi. At the 371 kW peak each cell carries 34 A, half its 70 A continuous rating, so the current rating did not set the parallel count.
What is the Reliance RS50 maximum discharge current?
The Reliance RS50 maximum continuous discharge current is 70 A, which is 14C, with a temperature cut-off at 80 °C. The datasheet gives no separate pulse rating, so this paper applies 70 A as the pulse limit as well. How much of that rating a pack can use continuously depends on its cooling: between 4.2C and 12.2C across the cooling levels simulated.
Is the Reliance RS50 suitable for eVTOL battery packs?
In simulation, the 222s16p Reliance RS50 pack completes a 21.6 minute eVTOL flight with a 371 kW peak demand. It lands at 24.9% state of charge, with a minimum cell voltage of 3.048 V and a peak cell temperature of 41.9 °C, both well inside the cell limits.
How much cooling does a Reliance RS50 battery pack need?
Below 2.4C a full discharge of the Reliance RS50 stays under 80 °C with no cooling. Above it, the highest continuous rate is 4.2C at 10 W/m²K, 8.4C at 50 W/m²K and 12.2C at 100 W/m²K. The simulated eVTOL mission runs at 70 W/m²K, forced air cooling with active thermal management.
Should a Reliance RS50 pack be side cooled or base cooled?
Side wall cooling reaches 87% of the Reliance RS50 surface and needs close to the full-surface heat transfer coefficient. Base and cap cooling needs 7.6 times it and base-only cooling 15.2 times, so a base-cooled pack exceeds the capability of air cooling at a much lower discharge rate. Choose the contact geometry and cooling technology together.
How does state of charge affect Reliance RS50 pulse power?
Reliance RS50 pulse power stays within a fifth of its peak across the upper two thirds of the state of charge range, then falls sharply. At 25 °C it halves at 19.4% state of charge for a 60 s pulse, 14.2% for 30 s and 10.9% for 10 s. A warmer cell holds full pulse power to a lower state of charge.
What state of charge reserve should a Reliance RS50 eVTOL pack keep?
The simulated mission lands at 24.9% state of charge, above the 60 s pulse power knee at 19.4% but on the declining part of the envelope, where a 60 s pulse delivers 62% of its peak. Set the reserve on pulse power as well as on remaining energy, and allow for a go-around moving the landing closer to the knee.