LG H52A in Electric Aviation and Space: Performance Beyond the Datasheet
- About:Energy

- May 11
- 20 min read
Updated: May 27

1 LG H52A Cell Overview and Positioning
The LG INR21700H52A is a 5.0 Ah high-performance lithium-ion cylindrical cell in the 21700 form factor, manufactured by LG Chem. As a tier 1 cell from one of the world's biggest battery manufacturers, the H52A targets electric aviation and eVTOL propulsion systems where gravimetric energy density, sustained discharge capability, and thermal behaviour are simultaneously constrained. Its tier 1 manufacturing standard and established supply chain reliability also make it a credible candidate for satellite and space power systems, where long-duration reliability and consistent cell performance are project requirements.
From the manufacturer's specification, the H52A delivers a minimum capacity of 5,000 mAh, 18.0 Wh of energy, and a nominal voltage of 3.6 V. The cell uses a Ni-based positive electrode chemistry and supports a maximum continuous discharge current of 40 A (8C), a maximum continuous charge current of 15 A (3C), and a discharge cut-off voltage of 2.5 V. Maximum cell dimensions are 21.4 mm diameter by 70.42 mm height, with a maximum mass of 66 g.
To ensure consistency across manufacturers, The Voltt reports energy density based on maximum cell mass. Using the maximum specified mass of 66 g, this yields a minimum gravimetric energy density of approximately 273 Wh/kg. At the continuous discharge rating of 8C, this corresponds to a gravimetric power density of 2,182 W/kg, positioning the H52A between the 5C and 10C iso-lines in The Voltt cell library and toward the right of the energy-power landscape, reflecting a cell that combines high energy density with meaningful sustained discharge capability.

These specifications raise practical questions that the datasheet alone does not resolve:
How does voltage hold under sustained high current demand during take-off and landing?
How much capacity remains accessible under realistic constant power loading as cell voltage declines through discharge?
At what point does thermal behaviour become the binding constraint, and how does the cell perform across the mid-SoC cruise window where most flight time is spent?
At what SoC does transient pulse capability begin to deteriorate?
These questions require validated simulation under mission-representative conditions to answer with confidence. The sections below apply lab-validated electrical models within The Voltt to evaluate rate-dependent discharge, sustained power loading, pulse demand, and a representative eVTOL mission duty cycle, defining the cell's practical operating envelope across the conditions most relevant to electric aviation programmes.
The Importance of Accurate Cell Selection
Choosing the right cell is one of the most important decisions in battery system design. It directly influences pack mass, thermal architecture, discharge limits, and overall system performance. In electric aviation platforms such as eVTOL aircraft, where both energy storage and high power delivery are tightly constrained by safety and weight requirements, small differences at the cell level can translate into significant system-level impacts.
While manufacturer datasheets provide baseline specifications such as capacity, voltage limits, and maximum current ratings, they rarely offer enough detail for confident system design. Information on temperature rise under sustained load, voltage behaviour across the discharge window, and performance under realistic cooling conditions is often missing or based on idealised test setups.
As a result, engineering teams face three recurring challenges in the traditional cell selection process:
Inconsistent benchmarking: Manufacturer data is rarely reported under identical test conditions, making direct comparisons difficult. Engineers must also validate whether published performance claims translate to their specific application and mission profile.
High testing overhead: Accurate characterisation and validation require specialised cyclers, environmental chambers, safety systems, and instrumentation. For many teams, this represents significant capital and time investment before meaningful conclusions can be drawn.
Delayed development cycles: Cell sourcing, shipping, and full qualification testing can add weeks or months to development timelines, particularly when down-selection involves multiple candidates.
To address this, this white paper applies lab-validated electrical models in The Voltt to evaluate the LG H52A under application-relevant conditions. By simulating rate-dependent discharge, sustained power loading, pulse demand, and eVTOL mission cycles, we move beyond static datasheet values and define the cell's practical operating envelope for electric aviation platforms under realistic scenarios.
2 LG H52A Cell Performance Characterisation
2.1 LG H52A Constant Current Test - Capacity Check

To verify the nominal capacity of the LG H52A, a capacity check was conducted at 25°C under controlled laboratory conditions. The cell was discharged at C/30 to minimise polarisation and establish baseline accessible capacity.
At C/30, the cell delivered a measured capacity of 5.35 Ah, exceeding the manufacturer's minimum specified capacity of 5.0 Ah. This confirms strong baseline energy availability and indicates the cell sits comfortably above the lower bound of cell-to-cell variation. It is worth noting that the minimum specified capacity is generally conservative and represents the lower bound of expected cell-to-cell variation across the production population. Voltage begins at approximately 4.19 V and declines progressively through discharge, with a more pronounced drop below 3.0 V as the cell approaches the 2.5 V cut-off.
For electric aviation applications, this baseline capacity result establishes the energy available under low-rate conditions. Subsequent sections evaluate how much of this capacity remains accessible as discharge rate and power demand increase to propulsion-relevant levels.
2.2 LG H52A Constant C-rate Simulation
To assess how the LG H52A responds to increasing discharge demand across its operating range, constant current discharges were simulated at 1C, 3C, 5C, 7C, and 8C under controlled thermal conditions. This sweep covers the range from moderate cruise-representative loads through to the manufacturer's maximum continuous discharge rating of 8C (40 A). It is important to note that 8C represents the derating threshold for the H52A, at which the 80°C thermal cut-off applies, while 7C sits below this threshold and completes discharge electrically. Both are included to define the boundaries of the cell's continuous operating envelope and to characterise the transition into thermally limited operation.

The voltage profiles are characteristic of Ni-based positive electrode chemistry, showing a continuously sloping discharge curve across all rates with no distinct plateau regions. At 1C and 3C, curves remain closely grouped with polarisation modest and voltage staying above 3.6 V through the majority of discharge, with capacity retention strong at both rates: 5.26 Ah at 1C (approximately 105% of the 5.0 Ah minimum specified capacity) and 5.12 Ah at 3C (approximately 102%). At 5C, separation from the lower rates becomes more pronounced particularly through the mid-discharge region, though the cell continues to deliver near-full capacity at 5.11 Ah (approximately 102%). At 7C, the curve sits noticeably below the lower rates but the cell completes discharge electrically, delivering 5.02 Ah (approximately 100%).
However, the peak temperature of approximately 73°C is a significant thermal load, and while the 80°C cut-off is not reached, this result indicates that sustained operation at 7C is approaching the thermal boundary and should not be treated as a comfortable continuous operating point without active thermal management. At 8C, the 80°C thermal cut-off is reached before full electrical depletion, terminating discharge at 4.97 Ah (approximately 99%). Notably, despite the early thermal termination, the cell has accessed the vast majority of its rated energy before reaching the cut-off, reflecting the H52A's ability to deliver meaningful capacity even at its maximum continuous rating before thermal limits intervene.

Power output at each rate reflects the combined effect of current and declining voltage through discharge. At 1C, power remains low and stable throughout, finishing at approximately 19 W per cell. At 3C and 5C, initial power reaches approximately 57 W and 96 W respectively, declining gradually as voltage falls through the discharge window. At 7C, initial power approaches 133 W before declining as polarisation increases toward end of discharge. At 8C, peak power reaches approximately 152 W in the early discharge phase before falling as the cell heats and polarisation increases, with thermal termination before full capacity is reached.

Thermal behaviour is well controlled up to 5C under moderate forced air cooling. At 1C, peak temperature reaches approximately 31°C, representing a modest 6°C rise from the 25°C starting condition. At 3C, peak temperature rises to approximately 46°C, and at 5C to approximately 59°C, both within manageable bounds for a forced-air cooled system. At 7C, peak temperature reaches approximately 73°C, a substantial thermal load that approaches the cut-off threshold and indicates active thermal management is required for sustained or repeated operation at this rate. At 8C, the 80°C thermal cut-off is reached before electrical capacity is exhausted, confirming that sustained operation at the maximum continuous rating is thermally rather than electrically limited under moderate forced air cooling. For eVTOL applications, these results indicate that sustained per-cell currents above approximately 5C require active thermal management, and that 7C and 8C operation should be treated as short-duration or duty-cycle-controlled conditions rather than continuous discharge rates.
Summary of Performance Metrics (Simulation)

Simulations were performed at C-rates of 1C, 3C, 5C, 7C and 8C starting from:
Initial SoC: 100%
Initial Cell Temperature: 25°C
Heat Transfer Coefficient: 50 W/m²K (moderate forced air cooling)
Minimum Voltage: 2.5 V
Maximum Temperature: 80°C
Why This Matters for Electric Aviation Design
The constant C-rate results define the thermal operating envelope of the LG H52A clearly. Up to 5C, the cell delivers strong capacity retention and manageable thermal rise under moderate forced air cooling, confirming suitability for the sustained mid-power phases that dominate eVTOL mission profiles. At the low end of the rate envelope, the near-identical capacity delivery at 1C and the minimal temperature rise confirm the H52A is equally well suited to satellite and space applications, where discharge rates are typically well below 1C and thermal stability over extended periods is a primary reliability requirement.
At 7C, the cell delivers essentially full rated capacity and completes discharge electrically, but the 73°C peak temperature confirms that active thermal management is required for sustained operation at this rate. At 8C, the maximum continuous rating and the derating threshold, the 80°C thermal cut-off is reached before electrical depletion, confirming that this rate marks the boundary beyond which thermal constraint becomes the binding design consideration rather than electrical capability. For take-off and landing phases where peak current demands approach these rates, pack configurations that distribute current across a greater number of parallel strings are necessary to maintain per-cell current within thermally safe bounds.
3 LG H52A Simulation and Mission Performance Analysis
3.1 LG H52A Constant Power Simulation
While constant current testing establishes rate-dependent behaviour under fixed discharge currents, constant power discharge captures a more representative operating condition for eVTOL propulsion systems, where motor controllers draw current dynamically to maintain thrust as cell voltage declines during discharge. Under constant power, current is not fixed but rises continuously as voltage falls, amplifying the electrical and thermal stress toward the end of discharge in a way that fixed-current testing does not reveal. To evaluate this behaviour, the LG H52A was simulated at five power levels: 10 W, 25 W, 50 W, 100 W, and 130 W per cell.

The voltage profiles follow the same continuously sloping shape characteristic of Ni-based chemistry seen in the constant current results. At 10 W, 25 W, and 50 W, voltage remains reasonably well supported across the full discharge window, with all three profiles staying above 3.6 V through the majority of mid-discharge before declining more steeply toward the 2.5 V cut-off, and the cell delivering near-full capacity across all three levels. At 100 W, voltage is more heavily polarised throughout, sitting around 3.65 V at the start of discharge and declining progressively to the cut-off at approximately 4.97 Ah. At 130 W, the combined effect of high current and rising resistive losses drives voltage down more sharply, terminating at approximately 4.74 Ah due to the 80°C thermal cut-off being reached before voltage depletion.

Under constant power, current is not fixed but rises continuously as voltage declines, a behaviour invisible in C-rate sweeps and directly relevant to propulsion system design. At 10 W, 25 W, and 50 W, current remains well within the continuous rating throughout discharge, reaching peak values of approximately 4 A, 10 A, and 20 A respectively, with the cell delivering near-full capacity across all three levels (106%, 103%, and 101% of the 5.0 Ah minimum). At 100 W, peak current reaches approximately 40 A toward end of discharge, corresponding to the 8C continuous rating, with capacity retention still strong at approximately 99%. At 130 W, peak current reaches approximately 54.6 A, exceeding the 40 A continuous rating for a significant portion of the discharge, and the 80°C thermal cut-off is reached at approximately 4.74 Ah (approximately 95% retention) before the cell can be fully depleted. For sustained operation at this power level, active thermal management beyond moderate forced air cooling would be required to extend the discharge window and prevent early thermal termination.

Thermal behaviour scales clearly with power level across the sweep. At 10 W and 25 W, peak temperatures reach approximately 29°C and 37°C respectively, representing modest rises from the 25°C starting condition and confirming operation well within safe thermal margins across both loads. At 50 W, peak temperature reaches approximately 49°C, manageable under moderate forced air cooling for single discharge cycles though warranting consideration in repeated mission scenarios. At 100 W, peak temperature reaches approximately 69°C, a substantial thermal load approaching the cut-off threshold that requires active thermal management for sustained or repeated operation. At 130 W, the 80°C thermal cut-off is reached before full electrical discharge, with temperature rising steeply through the latter half of the discharge. The progressively steepening temperature curves at higher power levels reflect the compounding effect of rising current on resistive heat generation as voltage falls through discharge.
Summary of Performance Metrics (Simulation)
Operating Conditions
Initial SoC: 100%
Initial Cell Temperature: 25°C
Ambient Temperature: 25°C
Heat Transfer Coefficient: 50 W/m²K (moderate forced air cooling)
Minimum Voltage: 2.5 V
Maximum Temperature: 80°C
Why This Matters for Electric Aviation Design
Constant power simulation provides an application-relevant view of the LG H52A's capability for eVTOL propulsion design, where power rather than current defines system requirements across flight phases. The results show that the H52A maintains strong capacity retention and controlled thermal behaviour across a wide power range. At 10 W through 50 W per cell, covering the cruise and approach phases of a typical eVTOL mission, the cell delivers near-full capacity with modest thermal load, confirming its suitability for sustained cruise operation under moderate forced air cooling.
At 100 W per cell, capacity retention remains at approximately 99% and peak temperature reaches 69°C, remaining below the thermal cut-off and demonstrating the H52A's ability to sustain high power output across the full discharge window. At 130 W per cell, the 80°C thermal cut-off is reached before full electrical depletion, though the cell still delivers approximately 95% of its rated capacity before termination, highlighting the importance of pack parallelisation and active thermal management for the most demanding flight phases such as take-off and landing.
These findings provide a clear framework for system designers to:
Define continuous and peak per-cell power limits across flight phases
Size parallel strings for current sharing under high-demand conditions
Design cooling systems to maintain thermal margin during peak load
Ultimately, constant power simulation reveals not just how much power the cell can deliver, but how sustainably it can deliver it within real mission constraints.
3.2 LG H52A Mission Profile Pack Simulation
While constant current and constant power simulations establish the cell's behaviour under steady-state conditions, mission profile simulation evaluates pack-level performance under a representative eVTOL duty cycle, capturing the dynamic contrast between high-power thrust phases, sustained cruise, and the thermal recovery that occurs as load transitions between flight segments. To evaluate the LG H52A under these conditions, a 222s16p pack was configured in The Voltt and simulated against the eVTOL passenger 800V duty cycle.
The configured pack delivers:
Pack configuration: 222s16p (3,552 cells)
Nominal voltage: 222 × 3.6 V = 799.2 V (~800 V class)
Capacity: 16 × 5.0 Ah = 80.0 Ah
Total energy: 63.94 kWh
Estimated pack mass (cells only): 234.43 kg
Simulation conditions:
Initial SoC: 100%
Initial cell temperature: 25°C
Ambient temperature: 25°C
Heat transfer coefficient: 70 W/m²K (active eVTOL thermal management)
Minimum voltage: 2.5 V per cell
Maximum temperature: 80°C

Pack voltage begins at approximately 930 V and dips sharply to approximately 855 V during the initial take-off phase as peak current demand reaches 532 A at pack level, corresponding to 33.28 A per cell and approximately 6.7C. Voltage recovers partially as the mission transitions into the climb phase before declining more gradually through the extended cruise segment to approximately 860 V, reflecting stable and predictable discharge behaviour under sustained moderate loading. During the final landing phase, power demand returns to take-off levels and voltage declines steeply to a minimum of 696.5 V, corresponding to 3.137 V per cell. This minimum remains comfortably above the 2.5 V per cell cut-off and no voltage-driven termination occurs at any point during the mission.
Across the approximately 1,230-second (~20-minute) mission, the pack delivers 45,924 Wh, corresponding to a 70.1% SoC reduction from 100% and finishing at 29.9% SoC. Peak pack power reaches 370.8 kW (104.4 W per cell) during take-off and landing phases, while average power across the mission is 136.7 kW (38.5 W per cell). Average per-cell current of 10.44 A (~2.1C) remains well within the continuous discharge rating across the majority of the mission, with peak per-cell current of 33.28 A (~6.7C) limited to the short-duration thrust phases. The cycle completes fully with no voltage or thermal cut-off approached at any point during the simulation.

The thermal response across the mission is driven by the sharp contrast between the high-power thrust phases and the extended low-power cruise segment. Cell temperature rises from approximately 24°C to a peak of approximately 33°C during the initial take-off phase as peak heat generation at pack level reaches 47.6 kW (13.41 W per cell). As the mission transitions into cruise, power demand drops substantially and heat generation falls to an average of approximately 0.58 W per cell during the cruise phase, allowing the 70 W/m²K active cooling to actively reduce cell temperature through the cruise phase, with temperature declining back toward ambient by mid-cruise. During the final landing phase, power demand returns to take-off levels and temperature rises sharply again, reaching a peak of 39.9°C at mission completion. Average heat generation across the full mission is approximately 1.92 W per cell, reflecting the dominance of the low-demand cruise segment in the overall thermal balance. The total temperature rise across the mission is 14.9°C and no thermal cut-off threshold is approached at any point during the simulation.
Why This Matters
The mission simulation demonstrates that the LG H52A, configured in a 222s16p 800 V architecture, can support a full passenger eVTOL flight cycle including two high-power thrust phases of take-off and landing and an extended cruise segment, while remaining within both electrical and thermal operating limits throughout. The 29.9% SoC remaining at mission completion represents a meaningful reserve margin, consistent with aviation safety requirements for energy reserves.
The thermal behaviour observed across the mission is particularly relevant for system design. The active cooling system's ability to reduce cell temperature during the extended cruise phase means the pack enters the landing phase from a lower thermal baseline than it left take-off, providing additional margin for the final high-power demand. The low per-cell heat generation during cruise, averaging approximately 1.92 W per cell, also reflects the operating conditions most relevant to satellite and space applications, where discharge rates are similarly low and thermal stability over extended periods is a primary design requirement. This behaviour highlights the value of adequate thermal management in eVTOL pack design, not only to manage peak thermal events, but to recover thermal headroom during lower-demand phases and support repeated flight cycles.
For engineers designing electric aviation battery systems, these results provide insight into how the LG H52A performs under realistic mission loading. The simulation captures voltage stability under transient thrust demand, current distribution across the parallel string configuration, and cumulative thermal behaviour under representative operating conditions, none of which are visible from static datasheet specifications alone.
3.3 LG H52A Pulse Power Capability Mapping
While constant power simulations define sustained operating limits, eVTOL missions also involve short-duration high-power demands at or near the cell's maximum rated current, such as during rapid climb or emergency manoeuvres. Pulse power capability mapping evaluates how much instantaneous power the LG H52A can deliver across the full range of SoC and temperature, providing a more complete picture of the cell's transient capability beyond what the datasheet alone can reveal.
Pulse discharge simulations were performed under the following conditions:
SOC range: 5% to 95%
Temperature range: 10°C to 60°C
Pulse duration: 30 s (discharge)
Minimum cell voltage: 2.5 V
Maximum cell temperature: 80°C
Maximum C-rate: 8C
Ambient temperature: 25°C
Heat transfer coefficient: 50 W/m²K
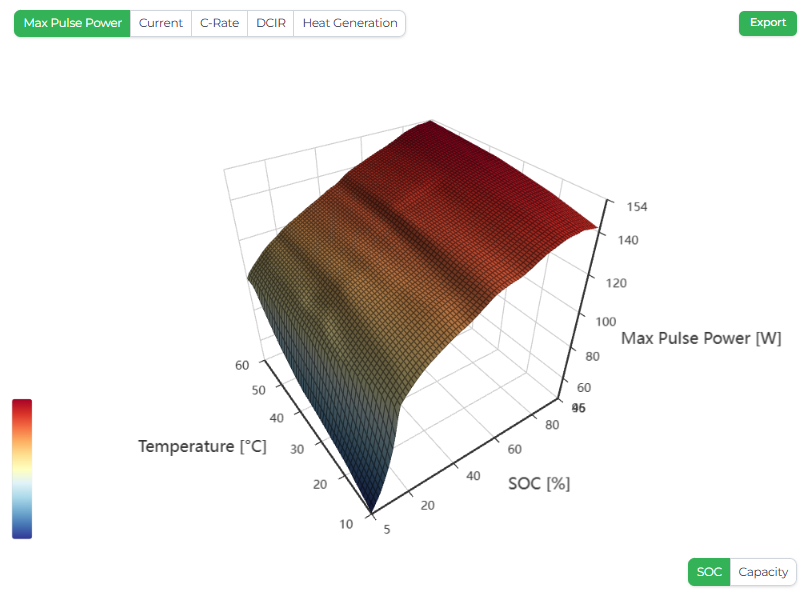
The results show that maximum pulse power scales strongly with SoC across all operating temperatures. For most operating temperatures, pulse capability remains broadly maintained down to a notably low SoC, with the knee point occurring at approximately 5% to 10% SoC, indicating that the H52A retains meaningful transient capability across almost the full discharge window. The exception is the 10°C isotherm, where the knee point shifts upward to approximately 15% to 20% SoC, reflecting the stronger influence of elevated internal resistance at low temperature on the available voltage headroom for sustaining a 30-second pulse above the 2.5 V cut-off. This is a positive characteristic for eVTOL applications, as it means the practical minimum operational SoC threshold is governed primarily by cold-temperature conditions rather than the cell's inherent electrochemical limits at normal operating temperatures.
At high SoC and elevated temperature, peak pulse power approaches approximately 154 W per cell, at which point the 8C C-rate constraint becomes the binding limit rather than voltage or thermal boundaries. This confirms that within the mid-to-high SoC operating window, the H52A can reliably deliver short-duration thrust bursts at or near its pulse rating.

Temperature has a clear and measurable influence on pulse capability, particularly at low SoC. At 5% SoC and 10°C, maximum pulse power is limited to approximately 48 W per cell, rising to approximately 61 W at the same SoC but at 25°C, a difference of approximately 13 W attributable to temperature alone. This reflects the influence of internal resistance on transient capability under cold and depleted conditions. At moderate operating temperatures of 25°C to 35°C and SoC levels above 40%, the curves converge and performance differences between isotherms become small across the mid-to-high SoC window. The 10°C isotherm remains notably suppressed relative to the others across the full SoC range, a relevant consideration for cold-weather eVTOL operations where pre-heating strategies may be required to restore full transient capability.
Why This Matters
For eVTOL platforms, pulse power mapping defines the transient capability envelope across the discharge window and identifies the SoC regions where thrust response margin is greatest. Above approximately 20% SoC and at operating temperatures above 25°C, the LG H52A demonstrates stable transient response, sustaining pulse demands up to the 8C limit without voltage or thermal cut-off. These results enable engineers to:
Define safe burst-power limits for take-off, climb, and emergency manoeuvre phases based on per-cell SoC and temperature state
Quantify transient performance margins across the operating temperature range, including the reduced capability at 10°C that may warrant pre-heating strategies for cold-weather operations
Validate that the mission SoC reserve is adequate. The 29.9% final SoC observed in the mission simulation confirms the pack comfortably avoids the region of reduced transient capability under the simulated passenger duty cycle
This mapping bridges the gap between continuous discharge ratings and real flight behaviour, providing the data needed to design control strategies and safety margins around actual cell performance rather than nominal datasheet specifications.
4 Engineering insights and conclusion
The simulation results show that the LG H52A combines high gravimetric energy density with a meaningful continuous discharge rating, delivering stable electrical and thermal behaviour across steady-state, sustained, and transient loading conditions.
At cell level, capacity retention remains at or above 102% from 1C through 5C, with peak temperatures of 31°C, 46°C, and 59°C respectively under moderate forced air cooling, confirming suitability for the cruise and climb phases that dominate eVTOL missions. The minimal thermal rise at 1C also makes the H52A well suited to satellite and space applications, where discharge rates are low and long-term thermal stability is a primary reliability requirement. Above 5C, thermal constraint becomes the primary design consideration.
At 7C, the cell completes discharge electrically but the 73°C peak temperature requires active thermal management for sustained operation. At 8C, the derating threshold, the 80°C thermal cut-off is reached before electrical depletion, though the cell still accesses the vast majority of its rated energy before termination. Constant power simulation reinforces this picture. Capacity retention remains at or above 101% up to 50 W per cell and approximately 99% at 100 W per cell. At 130 W, thermal cut-off limits delivered capacity to approximately 95%, underscoring the importance of pack parallelisation for the highest-load flight phases.
At pack level, the 222s16p 800 V configuration supports the full simulated eVTOL passenger mission, delivering 45,924 Wh across an approximately 20-minute flight cycle with a final SoC of 29.9% and a peak cell temperature of 39.9°C. Thermal recovery during cruise provides additional margin for the landing phase and supports repeated flight cycles. The pack mass of 234.43 kg reflects the H52A's high gravimetric energy density, a meaningful weight advantage for electric aviation platforms where mass budgets are tightly constrained.
Pulse power mapping shows that for most operating temperatures, transient capability is maintained down to approximately 5% to 10% SoC, with the knee point shifting to approximately 15% to 20% SoC only at 10°C. Above the knee point, the 8C C-rate constraint is the binding limit. The 29.9% final SoC from the mission simulation places the pack comfortably above the region of reduced transient capability throughout the duty cycle.
Together, these results define the practical operating envelope of the LG H52A. Dynamic simulation clarifies:
Usable energy under mission-representative load conditions
Thermal behaviour under realistic cooling conditions across all flight phases
Continuous and transient power capability across the discharge window
SoC-dependent transient performance margins and minimum operational thresholds
By linking validated laboratory data to system-level modelling, engineers can make informed decisions on pack configuration, parallelisation strategy, cooling system sizing, and operational SoC limits based on actual cell behaviour. The Voltt enables this transition from datasheet evaluation to mission-level validation, supporting earlier and more confident design decisions in electric aviation battery development.
Frequently Asked Questions (FAQs)
What are the key specifications of the LG INR21700H52A cell?
The LG H52A is a 21700-format cylindrical cell with a minimum capacity of 5,000 mAh, nominal voltage of 3.6 V, and gravimetric energy density of approximately 273 Wh/kg based on maximum cell mass of 66 g. It supports a maximum continuous discharge current of 40 A (8C), a maximum continuous charge current of 15 A (3C), and a discharge cut-off of 2.5 V. Laboratory capacity checks at C/30 confirm a measured capacity of 5.35 Ah, above the manufacturer's minimum of 5.0 Ah.
How does the LG H52A perform at high discharge rates?
Up to 5C, capacity retention is at or above 102% relative to the 5.0 Ah minimum, with peak temperatures reaching approximately 59°C under moderate forced air cooling. At 7C, the cell completes discharge electrically with essentially full capacity (5.02 Ah), but the 73°C peak temperature indicates active thermal management is required for sustained operation at that rate. At 8C, the manufacturer's maximum continuous rating, the 80°C thermal cut-off is reached before electrical depletion, though the cell still delivers approximately 99% of rated capacity before termination.
Is the LG H52A suitable for eVTOL battery pack design?
Yes. In a 222s16p 800 V configuration, simulation across a full eVTOL passenger duty cycle shows the pack completing the mission with 29.9% SoC remaining, a peak cell temperature of 39.9°C, and voltage never approaching cut-off. Peak per-cell current during thrust phases reaches approximately 6.7C, within safe thermal margins. The H52A's high gravimetric energy density also results in a cell-only pack mass of 234.43 kg, a meaningful weight advantage for platforms with tight mass budgets.
What is the LG H52A's thermal limit and how does it affect pack design?
The manufacturer-specified maximum is 80°C. Under moderate forced air cooling, this cut-off is reached at 8C continuous discharge, confirming that peak-demand phases such as take-off and landing require either active liquid cooling or pack parallelisation to keep per-cell current below the thermal threshold. At 7C, the cut-off is not reached but the 73°C peak temperature means sustained operation at that rate should not be treated as a comfortable continuous condition without active thermal management. At cruise rates below 3C, moderate forced air cooling is sufficient.
How does temperature affect the LG H52A's pulse power capability?
At most operating temperatures, pulse capability is maintained down to approximately 5% to 10% SoC before dropping sharply, giving the H52A a wider usable discharge window than many comparable cells. At 10°C, the knee shifts upward to approximately 15% to 20% SoC due to elevated internal resistance. At 5% SoC and 10°C, maximum 30-second pulse power is approximately 48 W per cell, rising to approximately 61 W at 25°C. Above 40% SoC, temperature isotherms between 25°C and 60°C converge and differences become small.
Can the LG H52A be used in satellite or space power systems?
The cell's low-rate thermal behaviour supports this application. At 1C, peak temperature rises by only 6°C from a 25°C baseline with capacity retention above 105%. For satellite discharge profiles well below 1C, thermal stress is minimal. The H52A's 273 Wh/kg energy density is also advantageous for mass-constrained space platforms. LG Chem's tier 1 manufacturing pedigree provides the consistency and supply chain reliability that space programmes require, with radiation tolerance, calendar ageing, and flight heritage qualification remaining standard additional requirements.