
UAV Battery Overheating: Causes and How to Prevent It

Updated: Aug 10

Why UAV cells overheat in a pack
Cells that overheat in a pack are one of the most reported problems in battery engineering, and UAVs get the worst of it. The cell test data looks fine, the pack gets built, and then the cells run hotter than the datasheet ever suggested they would. This can result in:
Power derated mid-mission, cutting capability and flight time
Cycle life below projection, because degradation is set by the hottest cell
Months of build, instrument, fly and iterate to find out
The reason is that a datasheet is measured in a very different thermal environment. A cell on a rig is exposed to air over its full surface, with clean conductive paths at the tabs. Weld it into a UAV pack and most of that convective area is gone, the tab path is a weld with contact resistance, and the whole assembly is shrink-wrapped or sealed in a casing. Heat transfer at the cell surface can drop by a factor of five. The figure below compares the temperature rise of a Grepow pouch cell in two thermal environments, showing a wide discrepancy between a cell tested in a thermal chamber, and the real result when assembled into a battery pack. Uncertainty over the magnitude of this rise leads to UAV companies committing to slow and costly build-test cycles, rather than trusting cell data from manufacturers or their labs.

The experimental test performances different in the pack. An open-air bench puts peak temperature 18.5 K higher, 56.4°C against 37.9°C, assuming 11 W/m²K for the built pack against 50 W/m²K for test-bench.
We set out to close that gap in Voltt, About:Energy’s online platform for cell and simulation and qualification. Working with Grepow's high energy density lithium-ion cells and an instrumented UAV pack, we took an 8S pack of Grepow cells, one drone mission, and the About:Energy’s Grepow model in Voltt, our cell evaluation platform. We then asked whether the model could predict what the thermocouples recorded.
The approach breaks into three steps:
Validate. Use one instrumented flight to establish the real thermal environment inside this specific pack, position by position.
Simulate. Build that environment in Voltt and confirm it reproduces the measured flight, both electrically and thermally.
Design. Point the validated environment at conditions that were never tested, new missions, new duty cycles, new pack layouts, and get an answer without building anything.
The build, instrument, fly, redesign loop that most UAV teams run several times over reduces to one virtual workflow. One flight calibrates the model and every mission, duty cycle and pack layout after that is assessed in simulation rather than in hardware.
Inside the pack: Grepow lithium-ion cells in an 8S drone battery
Grepow's GRP is a high-energy pouch built for multirotor endurance work. The datasheet states a 313 Wh/kg and 663 Wh/L pouch, 70% more gravimetric energy than a conventional high-power drone lithium polymer (LiPo) like the like the Tattu MA-8000 at 185 Wh/kg.
It gets there partly by giving up rate capability: 4.4C continuous, 60 A, against 10C and 137 A for a 15 second pulse on the Tattu cell. That trade-off is the reason this piece exists. An energy-dense cell with a modest continuous rating, arrayed eight in a row with cooling that weakens towards the centre, is exactly the geometry where a buried cell can run meaningfully hotter than its datasheet numbers suggest.
Cell | 8S1P pack | |
Chemistry | Lithium-ion | 8 cells, single lateral array |
Format | Pouch, 125 x 68 x 9.0 mm | 2 thermocouple positions, cells 3 and 5 |
Capacity | 13.7 Ah | 13.7 Ah |
Energy | 50.7 Wh | 405 Wh |
Nominal voltage | 3.70 V | 29.6 V |
Voltage window | 2.50 to 4.20 V | 20.0 to 33.6 V |
Continuous discharge | 4.4C, 60 A | 60 A |
Mass | 162 g | 1.30 kg of cells |
Higher energy density has a drawback on the thermal side. Packing more energy into the same volume also means less structure and less thermal mass around each cell to carry that heat away, and this pack is built for a small drone, where volume and mass are the priority, not cooling.

The pack. Picture of the 8S assembly of Grepow 13.7 Ah cells, later instrumented with two thermocouples in different positions.
Why the datasheet heat transfer coefficient does not apply to a pack
The mission flown is a drone test flight, current, voltage and temperature generated at 10 Hz. One gust rejection event drives the pack to 123 A in the eleventh minute, 9.0C on this cell, dropping pack voltage from around 29 V in cruise to 26.6 V under the spike before it recovers. Cruise itself sits at an average of 33 A . Both thermocouples keep climbing through the flight, TC-B peaking near 61°C against 56°C for TC-A, and neither turns over until the descent is done.
Two thermocouples are two data points. The pack has eight cells. What you can measure is what is happening at two surfaces. What you cannot know from the sensors alone is what is happening inside the other six cells, or whether TC-A and TC-B even capture the pack's worst positions. That matters because it is average cell temperature, not any single peak, that limits lifetime and state-of-power, and two sparse readings spread across eight cells can average away exactly the domain that is setting the limit.
That is the problem we built a toolchain to help with. Working backwards from the two measured points, it recovers the heat transfer coefficient for each of the two pack domains, so every cell is assigned the environment of its actual neighbours rather than a single pack-wide average. It will not catch a hot cell that no thermocouple's domain covers. What it does do is stop the worst measured domain from being averaged away.

The measured UAV mission. a 21.3 minute UAV mission profile. A gust rejection is the single worst event, inside the cell's 10C pulse rating; cruise sits at 2.4C, 33 A mean, well under the 4.4C continuous rating. 11.5 Ah and 326 Wh delivered, TC-A and TC-B peaking at 55.9 and 61.1 °C.
Once those environments are fitted, they're not tied to just this one flight. The same coefficients can be run against any mission profile, any duty cycle, any burst pattern, without touching a cell parameter or flying a second test. This pack validation turns one instrumented flight into a design tool, where new missions, new pack layouts and new operating limits can all be checked in software before a single extra hour goes on the bench for similar platforms.
Calibrating the pack, mean environment
Using Voltt, our battery simulation platform, we built the pack as an 8S1P using the Grepow cell model. We averaged the two thermocouples into one signal and found the single heat transfer coefficient that reproduces it, 8 W/m²K.
At that value the average pack temperature matches within 0.88 K over the full flight and pack voltage to 4.0 mV per cell, from one number for the whole pack. It cannot see the 5.2 K gap between TC-A and TC-B, which only the two-domain fit above shows.

Electrical response and the mean thermal response. One effective cooling environment, 11 W/m²K, holds pack voltage to 11.8 mV per cell and the three-thermocouple average to 1.05 K. The grey band, the measured spread across positions, is what a single environment cannot show.
There's a second gap worth explaining here. The model tracks a volume-average temperature, generated through the whole cell. A thermocouple only reads the casing, and the stack, tabs and pouch in between smooth and delay whatever reaches the surface. Push current in bursts, like this mission does, and the model's average temperature jumps on every peak while the thermocouple lags and dampens the same peaks. Think of a hob ring switching hard on and off under a thick pan. You only observe a smoothed, delayed version at the surface.
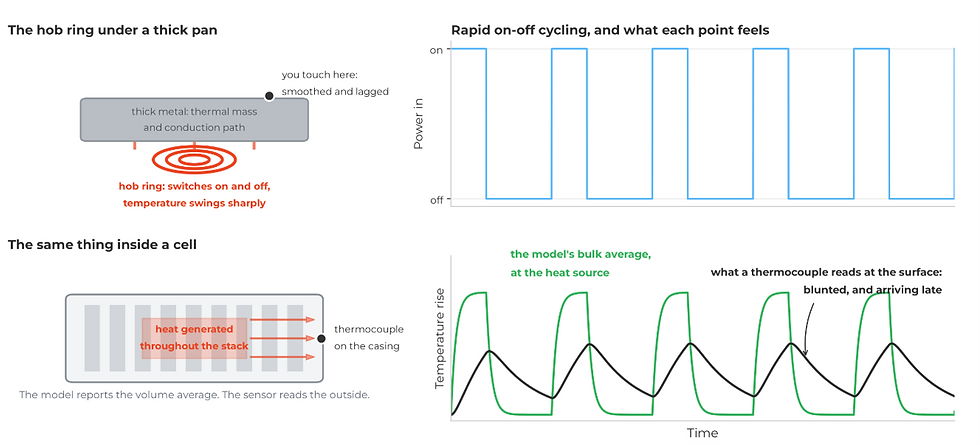
Model versus thermocouple. The model reports a volume-average temperature at the heat source; a thermocouple reads the casing, smoothed and lagged by conduction, the way a hob ring's swings soften through a thick pan.
Calibrating the pack, per position.
The mean fit is one environment standing in for two different ones. Split it back into T1, and T2, and fit each thermocouple its own heat transfer coefficient.

How the pack was represented in Voltt. One pack and two thermal domains. Each thermocouple position is given its own heat transfer coefficient and fitted against that sensor alone, so the buried cell is modelled explicitly rather than averaged away. Cell arrangement is indicative
Position | Fitted HTC | Temperature error | Peak measured |
TC-A, cell 3 | 10 W/m²K | 0.86 K | 55.9 °C |
TC-B, cell 5 | 7 W/m²K | 0.90 K | 61.1 °C |
The buried cell (TC-B) resulted in a lower heat transfer coefficient (7 W/m²K) against 10 W/m²K for the outer cell, explained by the more restricted thermal path, with roughly 30% less cooling from sitting between neighbours on both faces rather than at the edge of the array.

Per-position fit against measurement. Each thermocouple matched to its own heat transfer coefficient: TC-A to 10 W/m²K (0.86 K), TC-B, buried between neighbours on both sides, to 7 W/m²K (0.90 K) at its 61.1 °C peak. Pack voltage holds to 3.1 mV per cell. Model temperature is a volume average; each thermocouple reads the surface.
Simulating a mission that was never flown
This is the payoff. With the two environments fitted, the model can be driven with any load profile or pack layout, and nothing about the cells or their fitted thermal environment changes.
First, a new mission on the same pack. We took the mission's hardest 60 seconds, the takeoff climb, and flew it a second time, inserted 15 minutes in, and re-ran it. The buried cell (TC-B) rises 4.9 K to 67.5 °C. The outer cell (TC-A) rises 4.1 K to 61.9 °C.

One extra flight manoeuvre, no extra test. The mission's hardest 60 seconds, the take-off climb, flown a second time at 15 minutes, shown in blue. The buried cell (TC-B) rises 4.9 K to 67.5 °C; the outer cell (TC-A) rises 4.1 K to 61.9 °C.
Second, a new pack on the same mission. We rebuilt the pack as a 10S1P, two more cells in series rather than eight, and drove it with the same mission as measured power rather than measured current, since a mission is a power demand and a higher-voltage pack draws less current for the same flight. Cooling per position carried straight over from the fitted domains. Peak current falls 24%, the hottest cell drops from 62.5 to 46.1 °C, and the pack finishes the mission with 35% charge left instead of 16%.
No re-fitting is required in either case. No change to any cell parameter. Just a different current profile, or a different pack architecture, run through a cooling environment already recovered from the pack's own thermal fingerprint.

A 10S rebuild, tested before it's built. Same mission, run as power. Higher voltage cuts peak current 24%; the hottest cell drops from 62.5 to 46.1 °C and the pack finishes with 35% charge left instead of 16%. Simulated on the fitted cell model, assuming each thermocouple's domain keeps the heat transfer coefficient recovered from the pack.
A new toolchain for UAV pack design
UAV cells overheat in a pack for reasons that rarely trace back to the cell. The datasheet was measured in an environment nothing like a pack. What a thermocouple reads on the casing isn't what sets performance and safety - that's the internal average, which you can't observe directly. And pack thermal behaviour is genuinely nuanced, with position and neighbours changing the outcome cell to cell. Together, that's why the problem shows up at integration rather than at cell selection.
This case study is a workflow that gets ahead of these issues which delay product deployment. One instrumented flight, three thermocouples and a validated cell model produce a calibrated pack, with heat transfer coefficients tied to real measured positions rather than assumptions. That calibration is the input, not the output. Point it at a mission you haven't flown, a duty cycle you're only planning, or a layout you're still deciding between, all without new hardware.
It travels further than this one pack too. The same validate-once-then-simulate approach works for a different mission on this pack, a different pack built from the same cell, or a different cell entirely, provided a validated model sits behind it. Where a platform or cell hasn't been through this yet, this result still sets a useful bound: how far a first-pass thermal estimate can be from reality, and how much a fitted value can move once real data corrects it.
What to do with this
If you're designing a UAV pack, run your mission profile against a validated cell model before you find the hot cell the hard way. If you've already got a flight log sitting in a folder, it's worth more than one data point, it's a calibration for every mission you haven't flown yet.
FAQs (Frequently Asked Questions)
What is Voltt?
Voltt is About:Energy's battery model and cell library platform. It lets engineering teams simulate cell and pack behaviour, including the thermal effects shown above, before committing to physical prototypes or test campaigns.
What can you save by using Voltt?
Around 70% compared to physical test and design cycles, a figure validated by pack designers working across UAVs, aviation, motorsport, and robotics.
Why do UAV batteries overheat in a pack?
Datasheets are measured in open air, not packed against other cells. An energy-dense cell like the Grepow loses most of that cooling surface once it's built into an 8S pack with no gap between neighbours, so the datasheet's thermal figures don't hold once the pack exists.
What is a heat transfer coefficient in a battery pack?
A measure of how easily a cell sheds heat to its surroundings. High on an experimental test bench in open air, much lower buried in a pack with neighbours on both faces. In this study the two fitted positions came back 10 and 7 W/m²K, against a 50 W/m²K library default that assumes a thermal chamber.
Why do identical cells in the same pack reach different temperatures?
Position. Cell 5 sits with a neighbour generating heat on both sides and has almost nowhere to shed it except into them. Cell 3 is one position further out and keeps more exposure. Same cell, same current, and the buried one runs 5.2 K hotter throughout.
How accurate is battery pack thermal simulation?
In this case, 0.86 to 0.90 K across the two fitted positions and 0.88 K on the pack average.


