Battery Cell Selection: How to Choose the Right Cell for Your Application
- About:Energy

- Oct 5, 2023
- 13 min read
Updated: Nov 6, 2025
The Paradox of Choice: Why ‘More Batteries’ Isn’t Better. When engineers are faced with thousands of lithium-ion cell options, and more launching every month, selecting the best battery cell for a given application becomes increasingly complex. Whether you’re comparing the Molicel P60B vs P50B for high-power automotive systems or weighing the Amprius SA88 vs Inobat E10 for next-generation aerospace applications, more choice doesn’t always lead to better outcomes. Too many options can cloud decision-making, making it harder to identify the optimal cell chemistry, form factor, and performance profile for your design. This is the paradox of choice in battery engineering: abundance can obscure insight. It’s like game theory’s jam example; it’s tough to make the optimal choice when there’s so much to choose from. Learning to choose is one thing; learning to choose well is another. This selection dilemma is especially poignant in cell selection, where decisions at the start of a battery development programme have lasting impact on the performance, cost and carbon footprint of the system. About:Energy explores what matters in cell selection and how to use The Voltt to improve decisions in engineering teams.
Start exploring battery data and models like the Molicel P60B to reduce cell evalution time by 70%, with a 14-day free trial of The Voltt.

Bespoke lithium-ion cell design is not possible for the vast majority of companies that use lithium-ion cells for their technology. Only a privileged few get the opportunity to design a cell to operate perfectly for their application – the Tesla's (with Panasonic), the VW's (with Northvolt) and the BYD's (with themselves!) of our world.
Fortunately, cell manufacturers (such as Samsung or Molicel) offer an enormous range of lithium-ion cells to suit all sizes and all applications. Take the existing range of 21700 cylindrical cells offered by Samsung as an example. Their smallest cell (by nominal capacity) is 3 Ah (the 30T), and their largest is up at 5 Ah (the 50S). They offer cells that can fully discharge in 5 minutes (ideal for high-performance automotive applications, hybrids and drones) and cells that can store in excess of 250 Wh/kg (ideal for smartphones and smartwatches). Their range even includes different sizes of cylindrical cell, as well as other form factors (cylindrical, pouch and prismatic).
When we consider that there are 10+ major cell manufacturers offering a similar breadth of product range (and 100+ vying for a spot at the top), it is reasonable to state that the ideal lithium-ion cell for any one application does exist – the problem is finding it. System level constraints such as weight, volume and safety are driven by business-case requirements such as fast charging and lifetime extension. For example, a passenger automotive application would prioritise energy storage (i.e. range) and life, whereas a premium supercar manufacturer may prioritise power and fast-charging capability. In all cases, strict safety requirements (electrical, thermal and chemical) must be considered in the cell-to-pack scaling, meaning the cell with the highest energy density or best charging capability may not be the best cell to use in the battery pack. Selection of the most appropriate cell must consider this scaling - failure to do so leads to a subsystem optimisation trap.
At the other end of the spectrum, there are applications such as aviation where power and energy requirements are extreme - bordering upon unviable with present technology! In this case, the process of cell selection becomes much more fundamental - rather than optimising selection for a particular application, the engineer is first searching for any cell that could work for their application.
The Requirements - What Matters?
Every product development process will have its unique components, but, generally speaking, a certain application will have the following broad requirements from its battery:
Power capability – how quickly does the battery need to charge and discharge?
Energy density – how much energy needs to be stored in a certain mass and/or volume?
Thermal behaviour – how effectively can the battery be thermally managed?
Geometry – are there any sizing constraints for the lithium-ion cells?
Lifetime - how long is the cell expected to last during operation?

Typical trade-offs and system requirements to consider when defining cell requirements
The requirements for each will be specified before the selection process for the most appropriate lithium-ion cell kicks off. Further requirements, such as safety and reliability at cell level, all the way up to manufacturer pedigree, cell volume v/s cost trade-offs, and supply chain assurance at global market level, can make or break a decision about which cell should be selected.
The Problem - Decision Anxiety
In an ideal world, a company would receive a sample of every ‘might be suitable’ lithium-ion cell and run some preliminary tests to observe performance against their technology design requirements. This is impossible for all sorts of reasons – we have discussed the number of cell designs out there, the cost would be astronomical (for purchasing and for testing equipment), and the time taken to complete the empirical downselection would hamper product development.
Instead, cell down-selection (from hundreds of options, down to the chosen few for preliminary testing) is done through datasheets. This presents a problem because the datasheets provided by cell manufacturers are usually inadequate. Here, we have considered the parameters obtained from the Voltt for the Samsung 50G, a 21700 cell designed for high energy-density applications. Comparing against the initial requirement criteria for an effective down-selection process:
Power capability: maximum discharge current is 9.7 A. Taking nominal voltage of 3.63 V, perhaps a maximum power of 35 W in some operational conditions. We are not told how the cell behaves in sub-ambient thermal conditions!
(Gravimetric) energy density: we need to approximate this from the standard discharge capacity (4.85 Ah), the nominal voltage (3.63 V) and the mass (69.5 g), giving an estimate of 253 Wh/kg
Thermal performance: no information is given about the cell’s capability to reject heat.
Geometry: external geometry is given but geometry of the cap (where external connections would be made in the battery pack) is not.
Lifetime: At least 80% coulombic capacity retention after 1000 cycles (1C discharge, 0.33C charge). This is limited to arbitrary constant current testing - we are not told about real-world drive cycles or temperature-dependent cell degradation.
The result is a down-selection process built around a very limited pool of data. This shifts further emphasis onto the preliminary testing phase, which is expensive to delivery and increases the risk of a poorly selected lithium-ion cell for a technology application.
Cell Comparison in The Voltt
About:Energy’s Voltt is designed to enhance down-selection of lithium-ion cells. The Voltt takes the pain away from the customers by digitalising cell selection. This in turn facilitates the generation of battery pack concepts, yielding straightforward cell downselection.
The Voltt houses all the necessary characteristics and operational performance metrics for a vast range of lithium-ion cells. Immediately available, in a standardized datasheet format consisting of an executive overview, along with electrical, thermal, chemical, geometrical and mechanical parameters. Additional data to aid understand of the cell internal structures are also available such as SEM & XCT images, material composition, and engineering drawings.
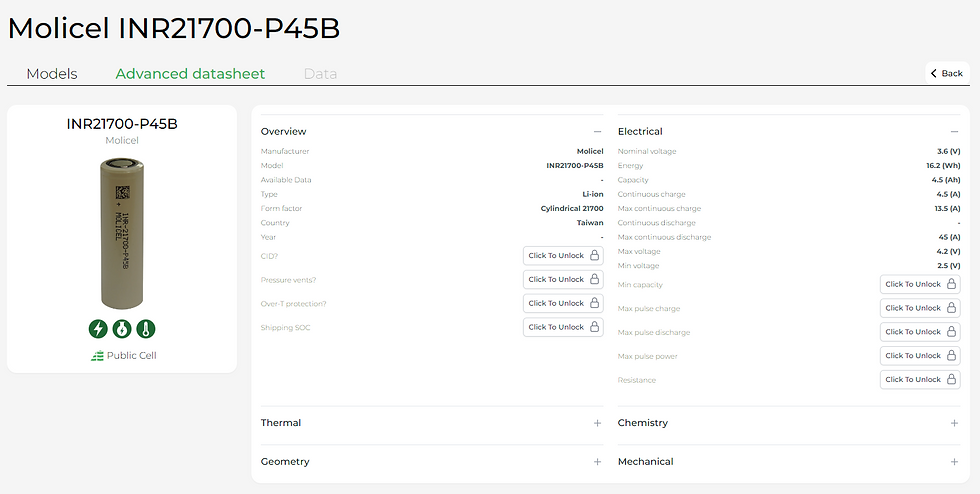
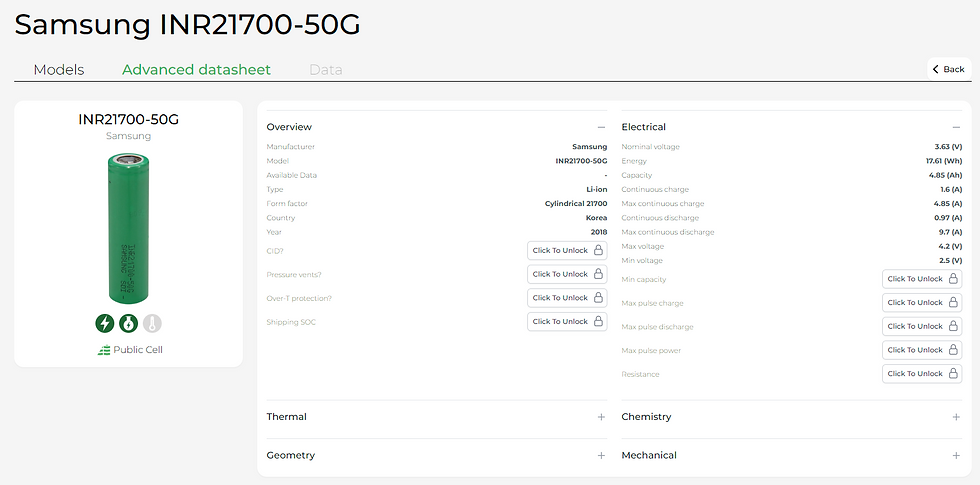
Advanced datasheet snippets for the Molicel P45B (top) and Samsung 50G (bottom) available on the Voltt.
The Voltt comes with built-in tools to aid comparison between any two cells. For example, we can see below a comparison of the Samsung 50G with the Molicel P45B - in this case represented by equivalent circuit models (ECMs). The Samsung 50G has a 5 Ah nominal capacity and a 18 Wh nominal energy storage capacity, whereas the P45B has a 4.5 Ah nominal capacity and a 16.2 Wh capacity. So you would think the Samsung 50G is the best cell to go for, to have the greatest range for an automotive battery pack. Below, we shall investigate this hypothesis, using thermally coupled equivalent circuit models (ECMs) representing each cell.
First, we have compared cell performance in terms of temperature rise whilst the cells are providing (i.e. discharging) 50 W of power for 100 seconds (beginning at 100% SOC). In this case, a forced-convection air cooling thermal boundary condition is applied within the model (a surface heat transfer coefficient of 10 W/m²/K). We expect the P45B to outperform the 50G because it is more rate capable, but we do not know by how much. We find that the Molicel P45B rises to just over 27.5 °C, whereas the Samsung 50G reaches almost 31 °C.
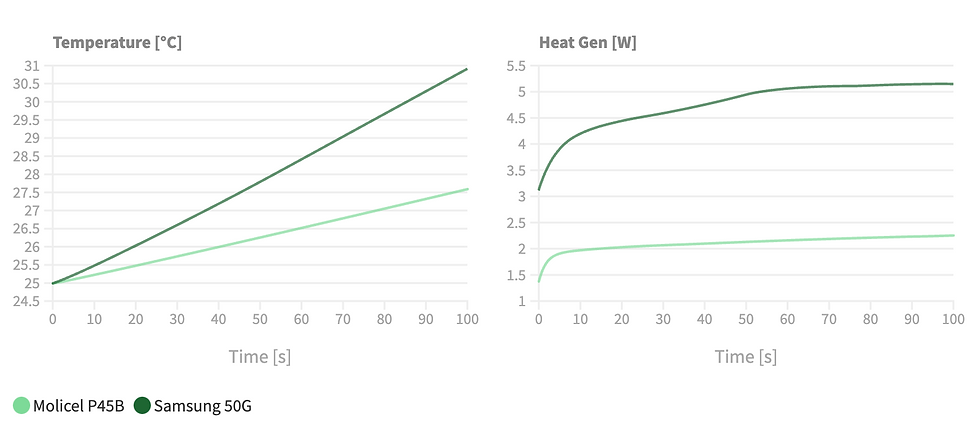
Comparison between Molicel P45B & Samsung 50G: Heat and Temperature for 50 W / 100 s Discharge Pulse
Temperature rise analysis could also be conducted experimentally with a programmable load and apparatus to set thermal boundary conditions such as an Accelerated Rate Calorimeter. However, the reason for the temperature rise (low heat capacity or high heat generation rate) can only be assessed through models such as those offered by About:Energy. Our models allow users to set initial conditions such as SOC and temperature, and allow flexibility in terms of setting the surface heat transfer coefficient, and the surface area for the thermal interface. Further, all our models are parameterised using experimentally determined specific heat capacity and thermal conductivity values - these are determined through our patented thermal characterisation processes.
In this case, the greater temperature rise in the 50G can be attributed to the higher heat generation rate - an average of 4.6 W, compared to 2.0 W for the P45B. Considering the thermodynamics of the cells, we can state that all wasted energy during the pulse discharge takes the form of heat. Therefore, we can calculate the energy efficiency ηₑ of each cell as:
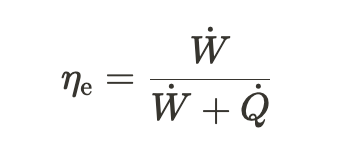
where Ẇ is the useful power out (rate of electrical work done, 50 W in this case) and Q̇ is the heat generation rate. It follows that the P45B has an energy efficiency of 96%, whereas the 50G is down at 92%. Clearly, the P45B is better suited to high power applications - this could have been worked out from datasheets alone. However, the quantifiable difference in performance is quite stark. The 50G is losing more than twice as much useful energy as heat, compared to the P45B.
About:Energy provides all this information to our customers as part of a subscription to the Voltt, which allows for such comparisons based on the power-to-energy ratio of the application. Users can select their cells by comparing for secondary factors such as energy efficiency and thermal performance and sensible cell selection decisions can be made with all the essential information available.
In the following sections, we look at how cell selection is most often done today, and take a deeper dive into the capabilities of About:Energy’s models and cell comparison platforms.
Accelerating Electrification with Rapid Qualification
A cell manufacturer’s datasheet cannot provide a comprehensive insight to the expected performance of a lithium-ion cell in a specific application. Performance characteristics included on such datasheets are extracted from experiments conducted in lab conditions with convective thermal control and constant-current discharges. These conditions do not correlate exactly onto the performance of a real cell, in a real-world application. A conventional cell selection process therefore requires extensive testing for a few different cells in these real-world scenarios. This requires lab space, battery cyclers and thermal control apparatus to represent a range of expected ambient conditions. More importantly, all this requires time. It is a barrier to entry and growth limiter for companies working in and moving into the battery/electrification sector.
The Voltt offers downloadable battery models so designers can observe the performance of any cell’s complete performance characteristics. These models can mimic the operation of any cell that is stored in the Voltt (we have already demonstrated this with the temperature rise comparison above), and can be used as building blocks to create battery packs. The aim of the Voltt is to digitalise aspects of the conventional battery experimental workspace – this includes comparative investigations of multiple cells and performance benchmarking against user-bespoke drive cycles and observing lifetime expectations. The work can be done by any engineer on a standard PC, at a fraction of the time and the cost that would be inherent to any experimental work.
Tailoring Decisions with our Digital Lab
Below, we have downloaded a thermally-coupled, lumped ECM from the Voltt, along with the parameter sets for the Samsung 50G and the Molicel P45B. Each cell is (in principle) suitable for automotive applications. First, we ran two back-to-back WLTP drive cycles through each cell model, beginning at 25 °C and applying thermal boundary conditions similar to those that would be present on a cell in an air-cooled battery pack. This is a typical first step for system designers and battery engineers when investigating if any cell is suitable for their applications - we’ve automated it, reducing a day in the lab down to a few seconds on a to run the test on a PC. We scaled the WLTP cycle so that 12 Wh was discharged from each cell over a 1-hour period. The first graphic shows the voltage response from the cell over the course of the 1-hour period. It is interesting to observe that the Samsung 50G cell exhibits a greater voltage drop (overpotential) during the test (indicated by the lower terminal voltage throughout the test). This is because the cell’s resistance is higher, so the overpotential across the cell during the discharge is larger.
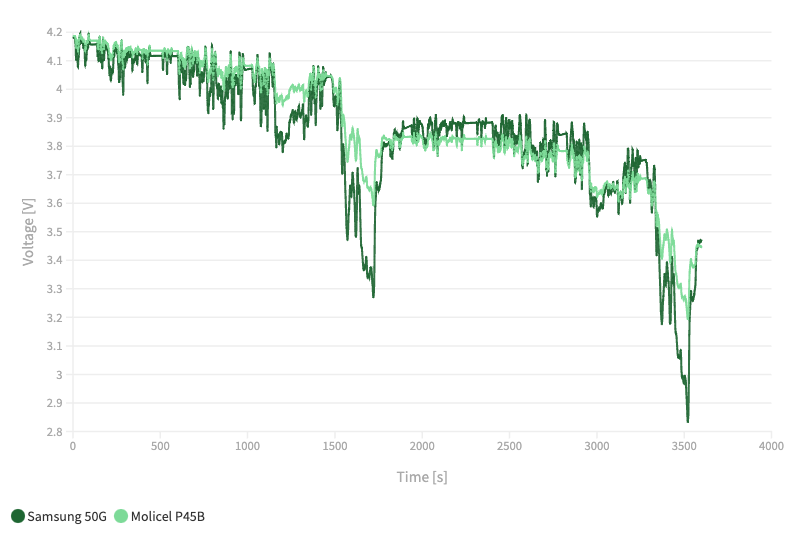
Comparison between Molicel P45B & Samsung 50G: Cell Terminal Voltage Simulated for Back-to-Back WLTP Cl. 3.
The greater overpotential in the 50G means that higher current is required to meet the power requirements of the WLTP. This can be seen below (left graphic) - a larger current is needed for the 50G. The consequence of higher current flow is a more rapid depletion of charge storage in the cell. This is also shown below (right graphic) - despite the larger nominal capacity of the 50G (5 Ah compared to the 4.5 Ah of the P45B), we actually see very little benefit in terms of SOC retention.

Comparison between Molicel P45B & Samsung 50G, simulated for Back-to-Back WLTP Class 3 (Scaled). Current flow from the cell (left) and cell SOC change (right).
If the 50G actually has little benefit in terms of depletion of charge (and thus vehicle range), then should the P45B be the preferred cell for this application? As mentioned above, the cost of purchasing these cells which would be a factor in real-world business decisions. Here we return to the thermal performance of each, using the WLTP testing profile and the air-cooled thermal boundary conditions. Below, the heat heat generation rate (left) and resulting temperature change (right) shows the considerable performance advantage of selecting the P45B.
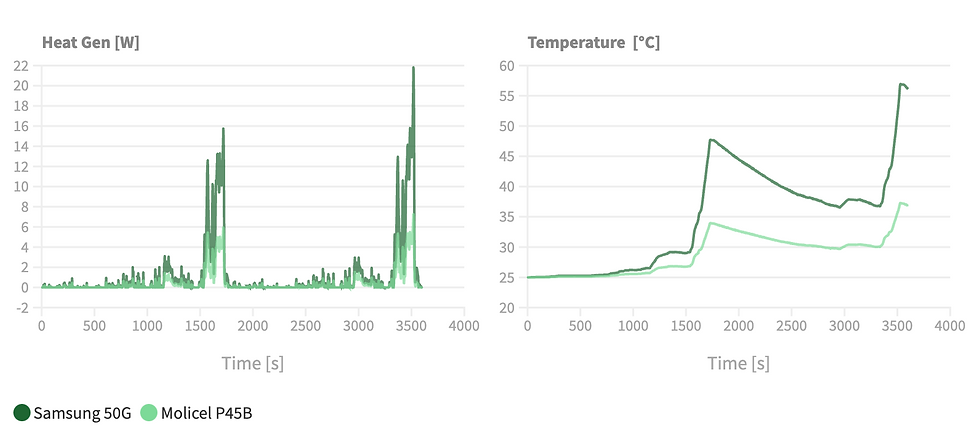
Comparison between Molicel P45B & Samsung 50G, simulated for Back-to-Back WLTP Class 3 (Scaled). Heat generation rate of the cell (left) and cell temperature change (right)
The thermal management system for the 50G must work twice as hard to remove the heat from the cell. Failure to do this effectively (as is the case in this modelled example, where we are limited to air-cooling) would result in the temperature rise shown above. We can actually evaluate the differing thermal management performance requirements of the two cells, using About:Energy’s models.
Given that the back-to-back WLTPs require 12 Wh in the test case under investigation, the Samsung 50G performs worse and generates 1.19 Wh of waste heat, compared to the 0.47 Wh generated by the Molicel P45B. This means a bigger, higher power and heavier thermal management system would be required, should the Samsung 50G be selected. Scaling this to pack-sizing (and assuming a 60 kWh battery pack), we can state with confidence from this data that a pack using the Samsung 50G (~3,334 of them) would require a thermal management system capable of removing around 5.4 kWh of heat. This is more than double for case if the Molicel P45B cell was selected (~3704 of them), where the thermal management system could be reduced to only extract 2.3 kWh of heat from the battery. Note, that choosing the Molicel P45B would make the pack 7% heavier given the higher number of cells; however, the accessible energy for a 60 kWh battery pack is almost 6% higher. Therefore, based on any weight constraints, there could be room to reduce the number of cells in the pack without compromising on battery pack performance.
Adjusting a vast range of variables is easy - for example we could in a few seconds change the surface heat transfer coefficients to represent a state-of-art immersion-cooled battery pack (such as what you might find in a supercar). As our models are ‘white-box’ and directly integrable to commonly used engineering simulation platforms, users can very easily add bespoke heat transfer elements based on their pack design, and draw out how these cells would be behave in different pack environments.
Degradation Awareness
Considerations for lifetime performance must be made when selecting the most suitable cell for an application. This is usually in the form of data available from the cell manufacturer, degradation models, or basic assumptions (such as capacity and resistance). Whilst this is somewhat useful during concept phase, for example to predict how long a battery pack might last in operation, the detailed design phase requires more complex degradation datasets to enable a greater depth of analysis, beyond just “this battery pack is likely to reach 100,000 km before end of life”. About:Energy’s ‘white-box’ models are developed specifically for this purpose - users can adapt the model with variable parameters (also provided by About:Energy) to represent different states of health to provide unrivalled data that feeds into the battery pack design optimisation process.
In the case below, we have compared the Molicel P45B’s behaviour at beginning of life (BoL) to its behaviour at middle of life (MoL, 90% SOH). Here, we have updated the model parameters (this is direct empirical data from our labs, mitigating the requirement for error-prone predictive health monitoring in reduced-order models) to represent MoL. The beauty of this process is that no effort is required to change the cell’s modelled SOH; it’s simply a matter of using a different parameter set.

Comparison between Molicel P45B (BoL & MoL) & Samsung 50G, simulated for Back-to-Back WLTP Class 3 (Scaled): Cell temperature change
The graphic shows how each cell’s temperature would rise over the course of the same WLTP cycle, with the same air-cooled thermal management boundary conditions applied. This is important because, with aging, the cell’s resistance will increase, leading to greater heat generation and reduced energy efficiency ηₑ. We can see that even at 90% SOH, the Molicel P45B does not heat up as fast as the Samsung 50G, despite the latter being a fresh cell. Note, the fresh P45B cell (100% SOH) reaches approximately 37 °C by the end of the cycle, whereas the MoL P45B reach to around 42 °C. This presents a good example of how thermal performance can drive cell selection, particularly considering factors such as aging. For more extreme operations, or if using a cell with an SOH< 90%, the temperature limit of the battery pack could be reached, limiting accessible performance.
Our models tell us that for this same WLTP drive cycle, the 90% SOH cell will lose 0.63 Wh to waste heat for every 12 Wh of useful electrical energy supplied to the vehicle’s powertrain. Compare this to the 100% SOH version of the same P45B cell - just 0.47 Wh of waste heat. This means for a 60 kWh battery pack, the energy lost as heat would increase by almost a third. The consequence is a requirement for a larger thermal management system, to handle this heat. This design requirement would not have been known using BoL data alone - including it allows engineers to design for performance across the entire life of the product. Failing to accurately characterise auxiliary requirements and associated weight and space budgets for the thermal management systems through a battery pack’s life risks the battery pack designer either over-sizing the pack, or (worse) causing product rollbacks due to warranty breach in performance.
About:Energy’s End-to-end Solution
Cell selection is a multivariable problem. Considering each optimisation characteristic independently leads to a subsystem optimisation trap which fails to account for other performance characteristics. About:Energy’s technology allows for battery pack design accommodating trade-offs in every direction, be it energy, power, thermal performance, charging, and life. The results, as we have demonstrated in this blog, highlight that designers should not optimise for energy density at cell level alone. Improved thermal performance and access to the energy store can enhance the real world operation.
The analysis walked through in this blog has employed simulated thermal boundary conditions representing a simple air-cooled thermal management system, where all surfaces of the cell are cooled evenly. During battery pack design, this would be just the first step. Additional considerations need to be made, with almost all real-world applications for cylindrical cells employing either base (bottom) cooling or side cooling. To read more about this, check out our recent blog on the Molicel P45B: Exploring Molicel’s new power cell (aboutenergy.io).


